In June 2020, the International Monetary Fund reduced its quarterly outlook to forecast slower economic recovery than previously expected from the Covid-19 pandemic.
Is this the worst economic crisis since the Great Depression for every sector?
Recent tumultuous market conditions and pandemic-driven economic stress has adversely impacted the performance of many business sectors and companies worldwide.
This study examines the financial performance of various business sectors like Healthcare, Retail, Industrials, Energy, Telecommunication, Real Estate, Metals & Mining, Technology, and Streaming Media by looking into their stock price and business volumes over the past year (May 2019 to April 2020).
Analytics Tools
I selected Microsoft Power BI and Snowflake Database for my analysis:
- Microsoft Power BI is currently one of the fastest-growing business intelligence tools in the market and was selected to derive meaningful insights into the data. Critically, Power BI integrates seamlessly with cloud databases like Snowflake.
- Snowflake Database is a cloud-based database with limitless storage virtually. Importantly, once the data is uploaded to it, it can be accessed from any location with the help of a browser. The focus of including Snowflake in this solution is to enable everybody to use this analysis, irrespective of their location or even if the device in use does not have any data base installed to it.
Analytics Solution
The procedure I addressed for my analysis:
- Data was sourced from Yahoofinance.com in Comma Separated File (CSV) format for some of the top-performing sectors and companies in Australia and the USA for the period 1-May-2019 to 30-Apr-2020. The Covid-19 period is considered to run Jan 2020–April 2020, and non-pandemic period is taken to be May 2019–Dec 2019.
- The data was sourced into 3 flat files namely Companies, Sectors, and Countries.
- The data that is collected was then uploaded to a Snowflake Database using SnowSQL. This involved creating supporting objects in Snowflake like Databases, Schemas, Virtual Warehouses, User, Role, Privilege, File Formats, and Stages.
- Microsoft Power BI was then connected to Snowflake, to access the data to include in the analysis.
- The Covid-19 data was provided by John Hopkins University through Starschema (https://starschema.com/) and Snowflake’s Data Exchange was also included in the analysis.
Visual Walk-Through: Analytics Procedure
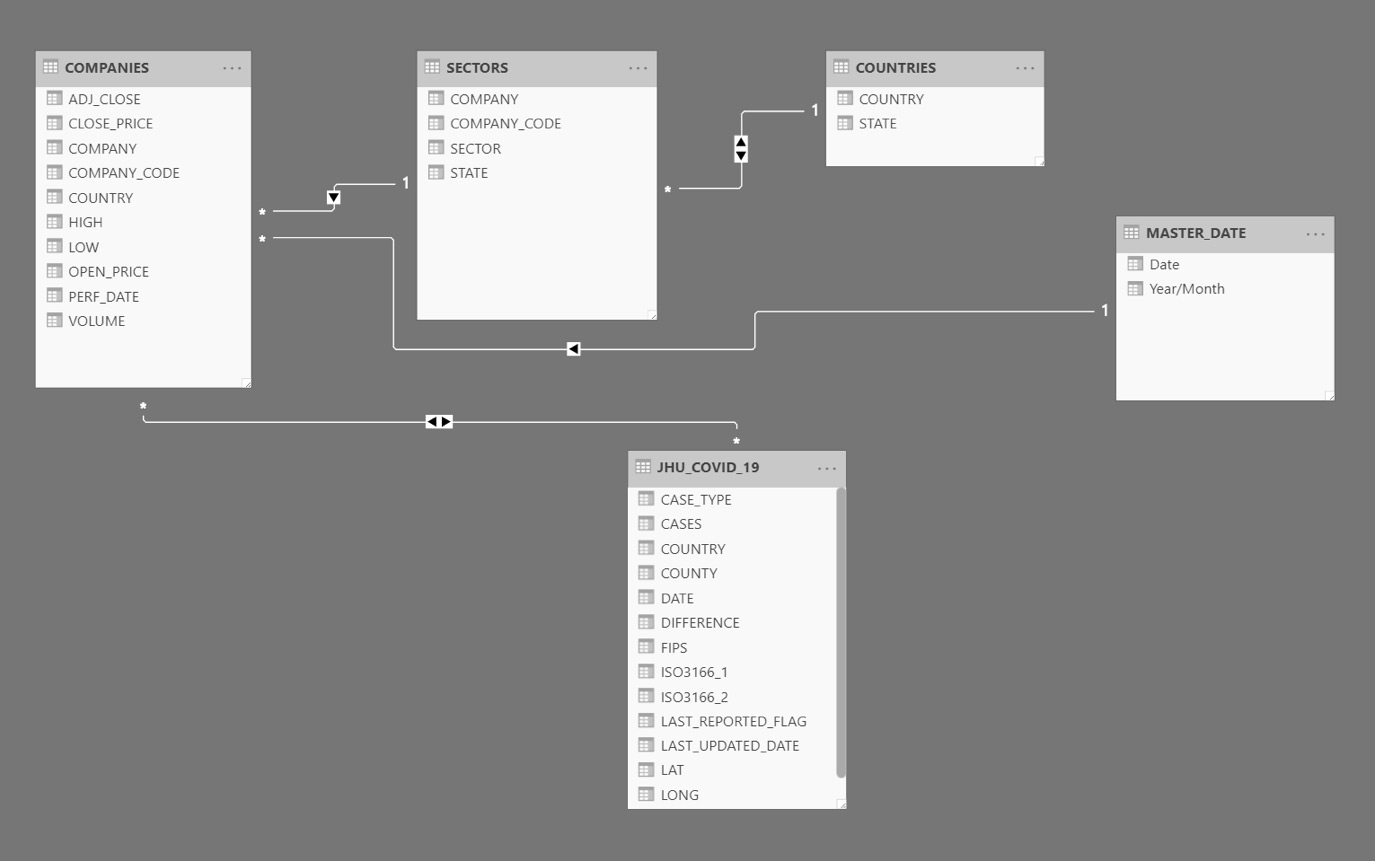
Data relationships between the tables were established per below:
Microsoft Power BI Dashboard
- Home Page
The home page navigates to all other pages: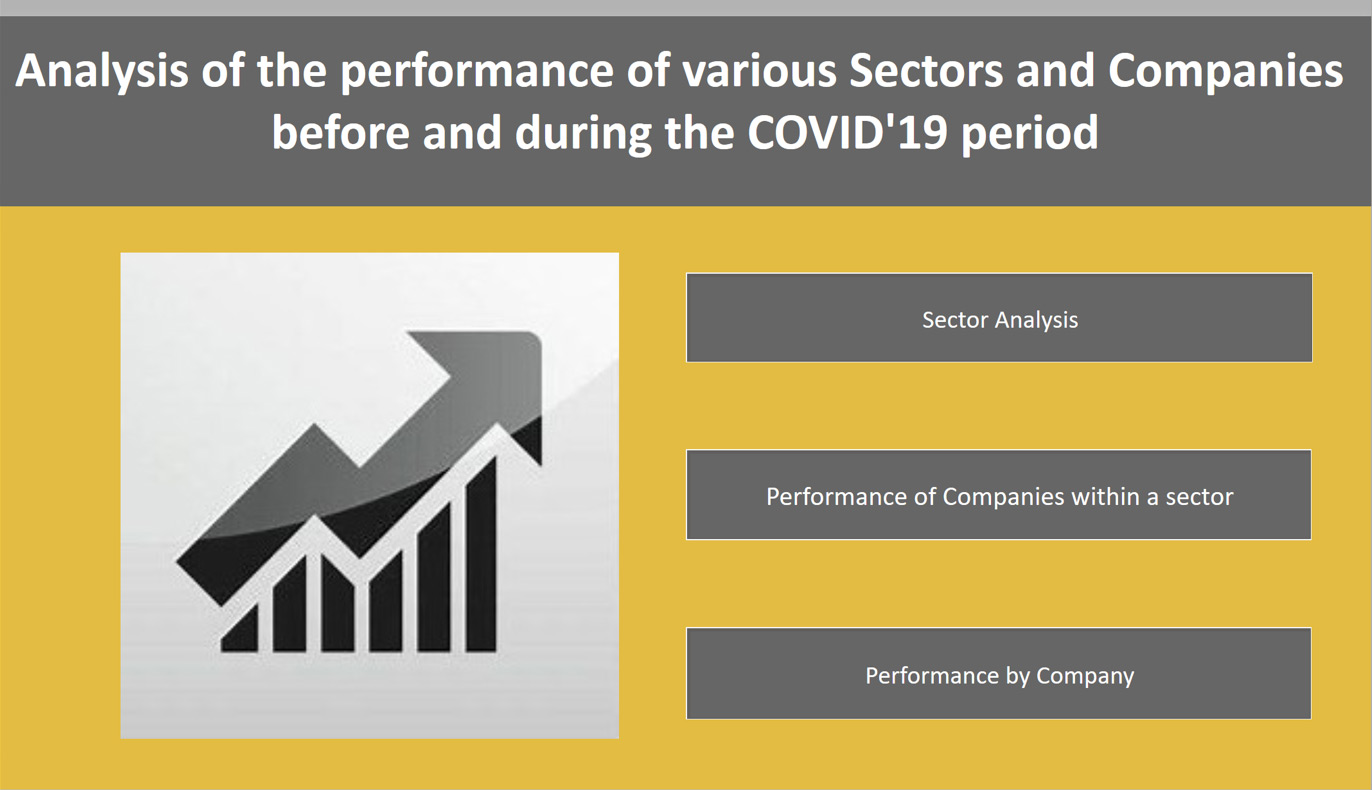
- Sector Analysis
Sector performance is analysed and displayed via a Line Graph – based on the stock price of the sectors by calculating the percentage for the average stock price.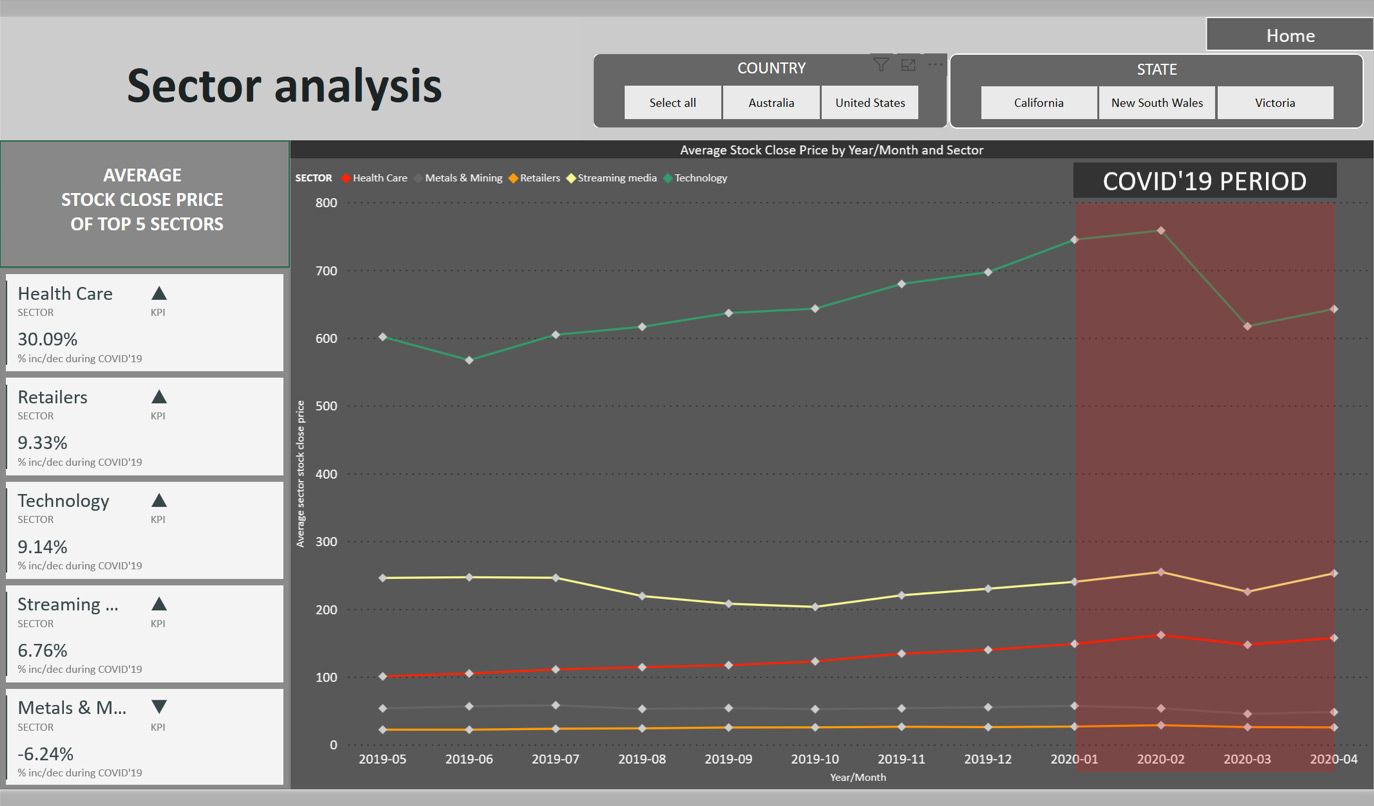
The Red Zone represents the Covid-19 period, showing how each sector performed during that period. On the left-hand side, the percentage value indicates the performance of the sector during Covid-19 period, comparative to the pre Covid-19 period.
- Performance of Companies within a Sector
Sector performance is analysed and shown through the Bar Chart – based on the stock price of companies by calculating the percentage of the average stock price.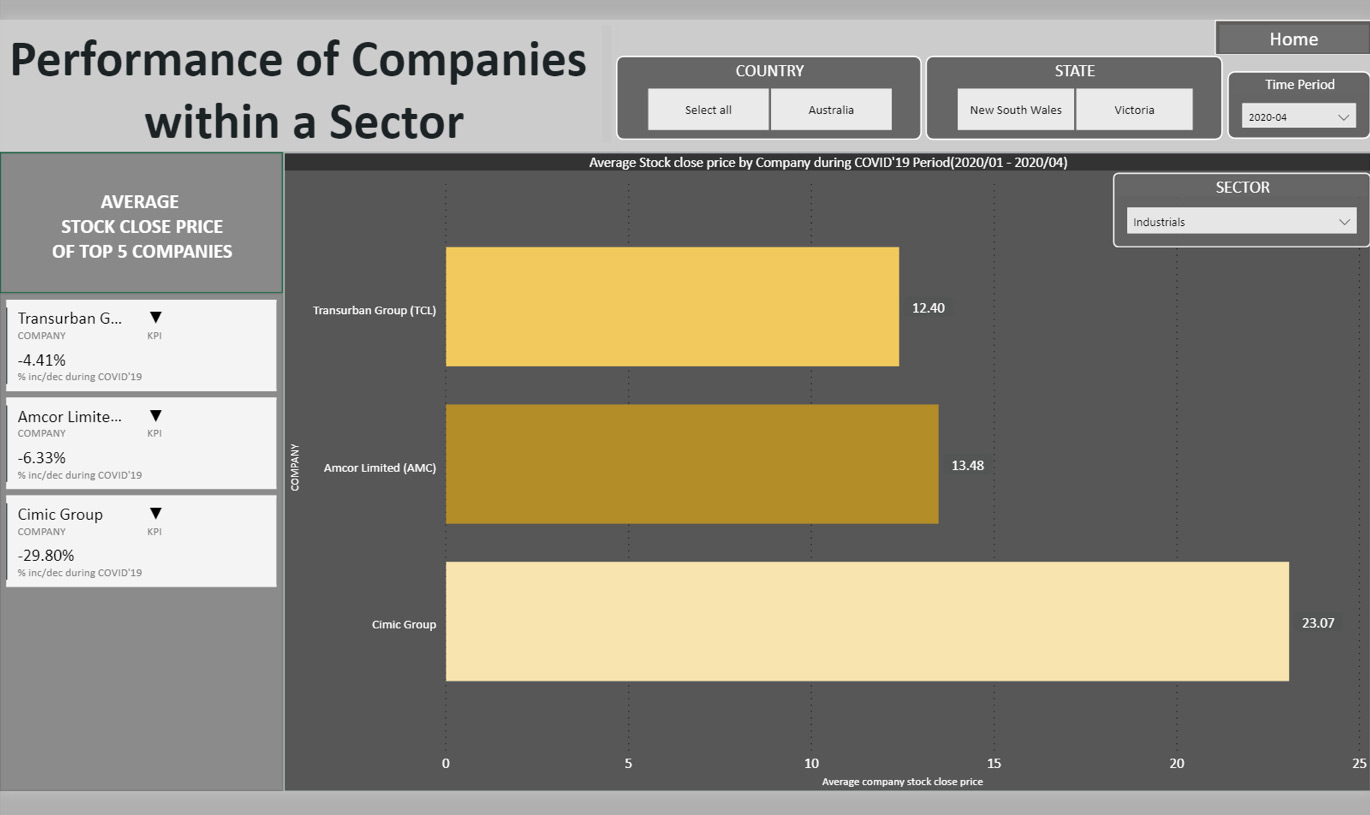
- Performance by Company
The performance of companies is analysed within the sector via the line and bar charts – where the line chart depicts the stock price and the bar chart depicts volume.
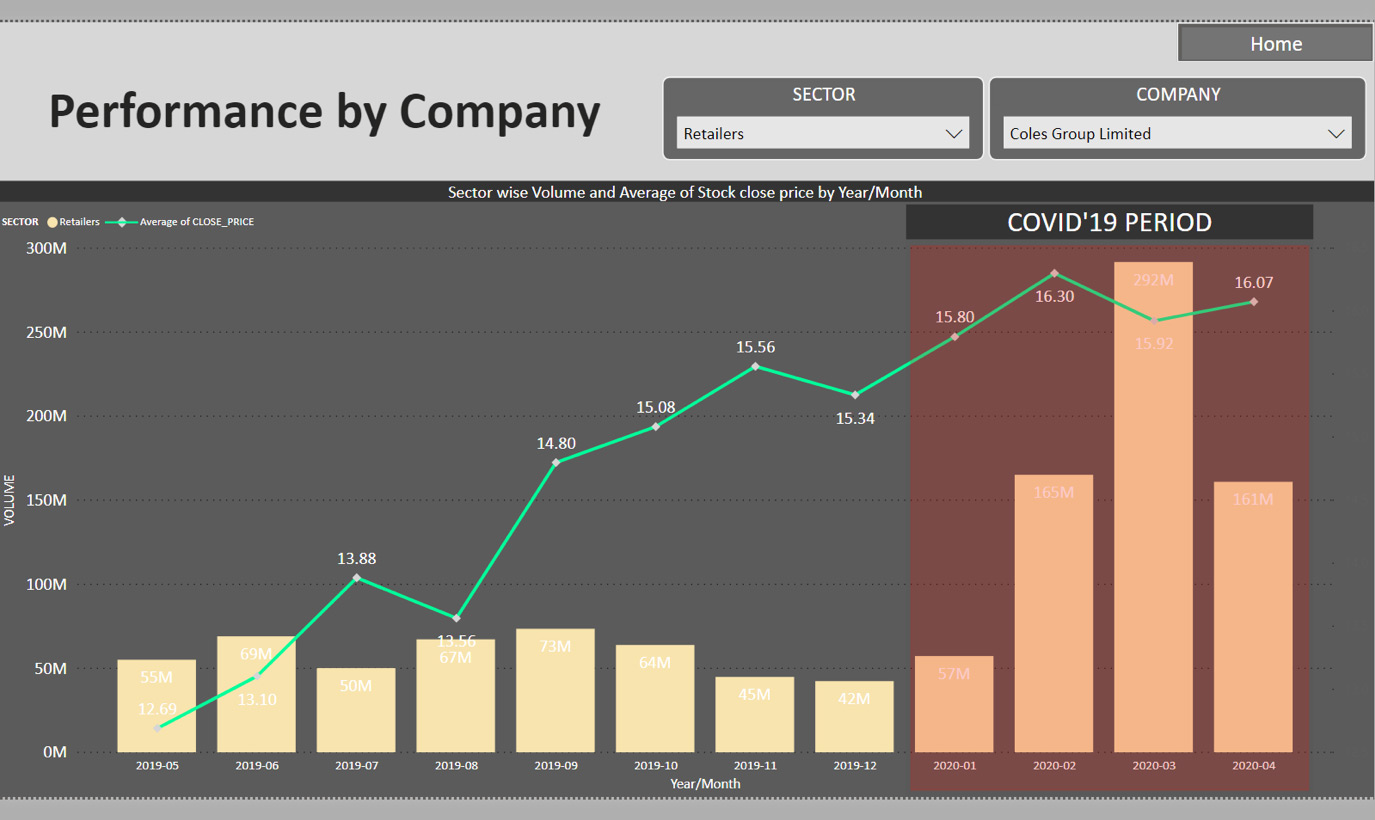
The Red Zone represents the Covid-19 period – how each company performs during that period compared to the pre Covid-19 period.
Outcomes from the Analysis
Although Covid-19 has negatively impacted the performance of many sectors including Tourism, Education and the Sports Industry, the impact is uneven across sectors and companies, due to the crisis driving substantial differences in demand for certain products and services.
Some sectors have ramped or increased performance during this period. There are significant differences in impact, , both upside and downside economic outcomes, across different sectors, from the pandemic.
From this crisis, Healthcare, Technology, Retail & Streaming Media sectors have seen a volume increase in subscribers and user base, and growth in sales. Hence, that has reflected positively on their stock price.
In this era of big data, there are many data analytical and visualisation tools in the market that could enact the same analysis.
I leveraged Microsoft Power BI as I find it user-friendly, cost-effective and it works seamlessly with cloud databases like Snowflake. Snowflake’s serverless data warehouse architecture is flexible and easy to use, with powerful on-demand cloud data warehousing that enables data storage, analytic and group computing, and sharing, all in real-time.
Do you need to break down data silos, derive insights and deliver value from data in new and seamless ways? Talk with Tridant. These are the challenges we like to solve!
Hemasri Chappidi | Michelle Susay


